Exploring network traffic with iftop
Introduction:
Hello tech nerds! Today, we’re delving into the realm of network exploration with iftop, a tool designed to demystify the flow of data on your machine. Whether you’re a tech pro or just someone curious about their network activity, iftop is your ticket to understanding what’s happening behind the scenes.
Understanding iftop:
Iftop is like a magic window into your network world. It gives you a neat table that spills the beans on how much bandwidth each host is currently consuming. It’s like having a detective tool that spots the hosts responsible for slowing down your network, placing them right at the top of the list for easy identification.
Features Breakdown:
- Reveals send and receive data transfer rates over the last 2, 10, and 40 seconds.
- Organizes bandwidth usage by host on a specific interface.
- Listens to network traffic on either the default or a specified interface.
- Requires the user to have superuser or SUDO privileges.
Installation:
Before we dive in, make sure the iftop is hanging out on your system. Here’s how to install it based on your Linux flavor:
For Redhat/Fedora/CentOS:
# yum install epel-release -y
yum install iftop -y
For Ubuntu/Debian:
# apt install iftopGetting Your Hands Dirty:
With iftop installed, kick things off by simply typing:
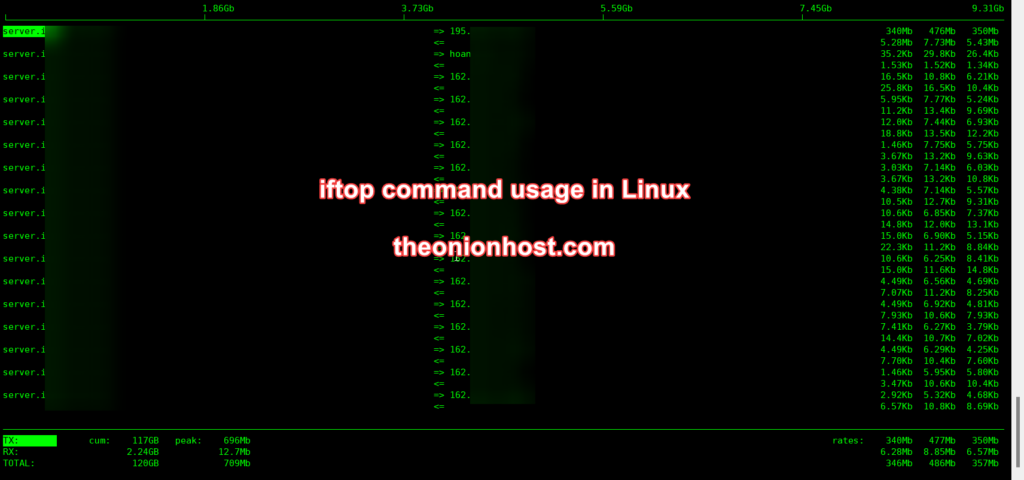
iftopNow, sit back and feast your eyes on the visual representation of your network traffic taking up the entire screen. The logarithmic scale at the top serves as a quick reference for the traffic intensity.
Deciphering the Output:
The main stage displays, for each host pair, the speed at which data was sent and received in the last 2, 10, and 40 seconds. Directional arrows provide a clear map of data flow. The stars of the show, hosts causing the most traffic (based on a 10-second average), take the top billing.
At the bottom of the screen, find a treasure trove of traffic statistics, including peak traffic, total traffic transferred, and average transfer rates over different time spans.
Targeting a Specific Interface:
If your machine boasts multiple interfaces, target a specific one using:
iftop -i interface_nameMaking Sense of Traffic Stats:
Navigate to the bottom of the iftop output to uncover overall traffic statistics:
- TX: Amount of traffic sent
- RX: Amount of traffic received
- TOTAL: Grand total of traffic (TX plus RX)
- PEAK: Peak bandwidth usage
- AVG: Average bandwidth usage over the last 2, 10, and 40 seconds
Exploring Options:
To discover additional options for effective network traffic monitoring, unveil the possibilities with:
iftop -hConclusion:
You’ve just embarked on your network monitoring journey with iftop. Whether you’re fixing issues or just feeding your curiosity, iftop is your trusty sidekick. Happy exploring!
Both the new and old servers were purchased from theonionhost.com visit: https://theonionhost.com/dedicated-hosting